Technical Analysis Course

Mini technical analysis course – an introduction to charting.
In the reading of any chart formation, it is important that the underlying explanation of what is happening is held in mind.
Random Walk – Trending – Discounting – Congestions – possible Reverse Formations – Fundamentals – “floors” and “ceilings” – for each commodity all help in the interpretation of charts and help prevent some of the more spurious reasoning that can cum from technical studies.
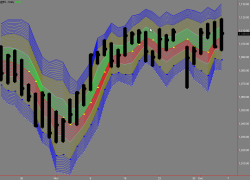
My advice is not to lean too heavily on mechanical approaches to market analysis, for example, relying solely on when moving average lines criss-cross or any other of those “silly” little lines. This removes the trader from the human elements, which make up so much of the correct analysis of price movements. If the mechanical approaches really performed all that well, profits wud disappear, because everyone wud apply similar analytic procedures.
Technical Analysis Course: Credits
The material on this site is excerpted from the book “How to Make Money in the Futures Market . . . And lots of it.” By Charles Drummond (Copyright © 1970 by Charles Drummond. All rights reserved).
Charles Drummond is a Canadian trader who has written nine books about trading and has created a method of technical analysis called “Drummond Geometry.” His biography and further information about his work can be found at technical analysis course
